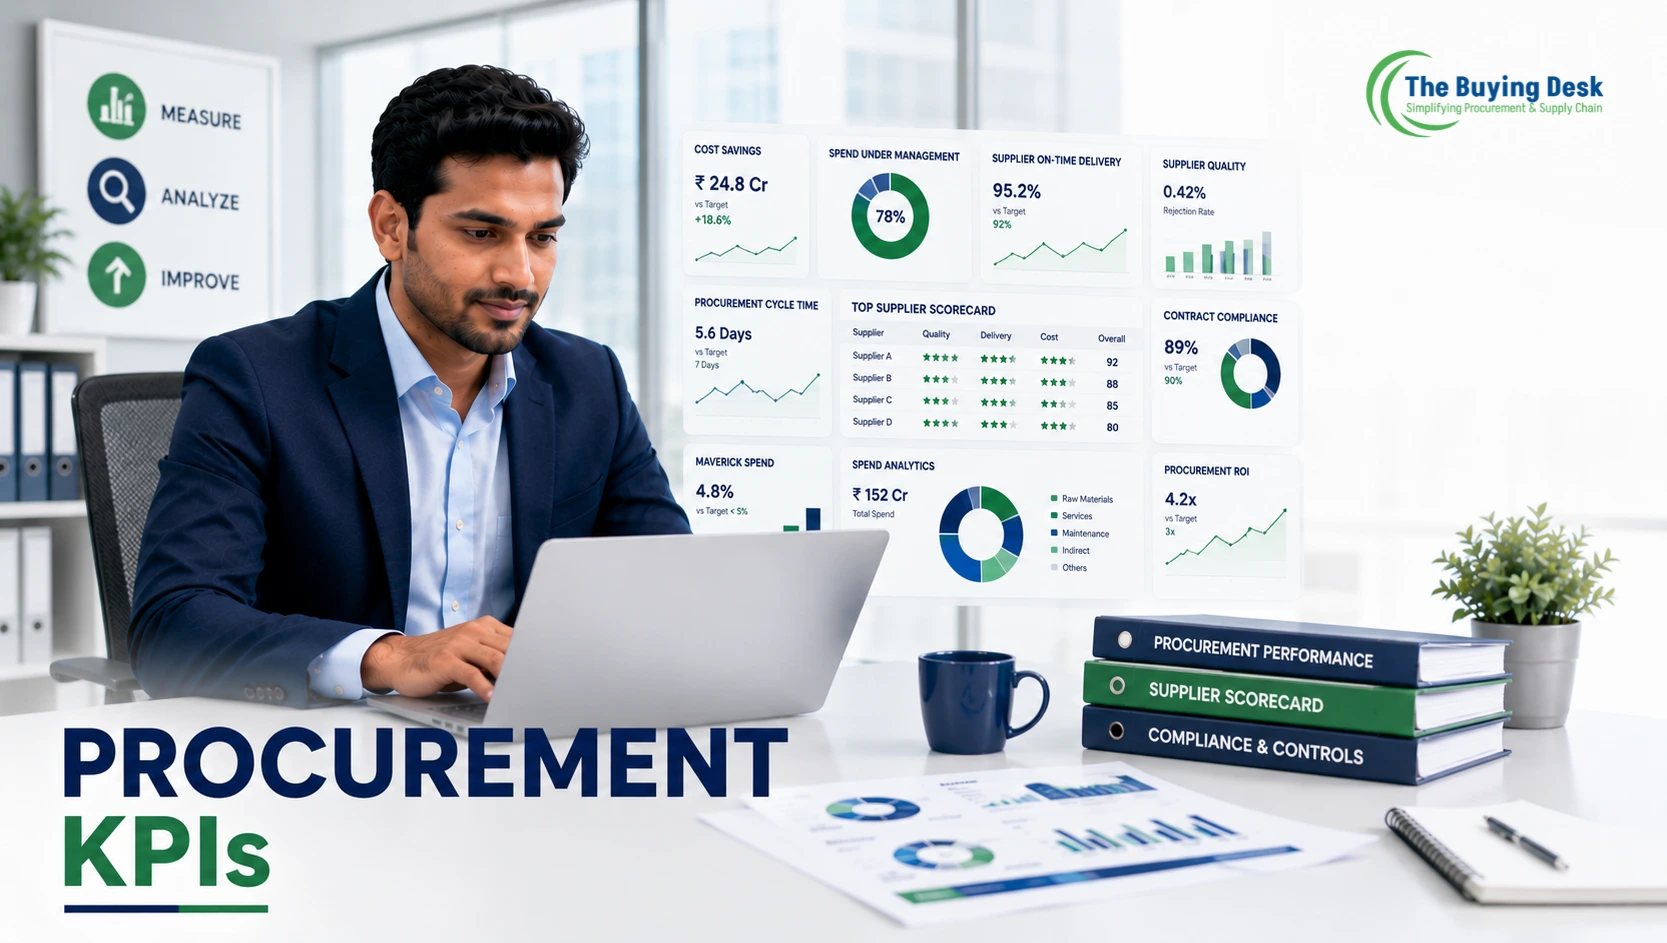
Procurement has traditionally been associated with one simple question:
“How much did we save?”
But modern procurement is much broader than cost reduction.
A procurement team can negotiate a lower price and still create a business problem if:
This is why organizations need a broader approach to measuring procurement performance.
Procurement KPIs help organizations understand whether procurement is actually delivering the expected business value.
A strong procurement measurement system should look at several dimensions:
Cost + Quality + Delivery + Supplier + Process + Compliance + Risk + Business Value
This article explains the most important procurement KPIs, how they are calculated, what they tell procurement teams and how to build a practical procurement dashboard.
Procurement KPIs, or Key Performance Indicators, are measurable indicators used to evaluate the effectiveness, efficiency and business impact of procurement activities.
They help answer questions such as:
A KPI should not simply produce a number.
It should help the procurement team make a better decision.
Without KPIs, procurement performance can become subjective.
Management may hear:
“We negotiated good prices this month.”
But that statement does not tell the complete story.
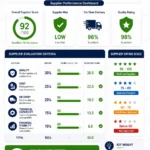
A procurement dashboard can show:
This creates a more objective view of procurement performance.
The terms KPI and metric are often used interchangeably, but there is a useful distinction.
A metric measures something.
A KPI measures something that is particularly important to achieving a business objective.
For example:
Number of purchase orders processed is a metric.
Purchase order cycle time may be a KPI if reducing processing time is an organizational priority.
Therefore:
Every KPI is a measurement, but not every measurement needs to be a KPI.
A mature procurement dashboard should generally cover several categories.
Measures financial performance.
Measures supplier reliability and performance.
Measures supplier and material quality.
Measures supply reliability.
Measures how efficiently procurement operates.
Measures adherence to procurement policies.
Measures exposure to supply and supplier risks.
Measures procurement’s contribution beyond transactional purchasing.
Cost savings is one of the most commonly tracked procurement KPIs.
It measures the reduction achieved compared with an established baseline.
A simplified calculation is:
Cost Savings = Baseline Cost − Negotiated/Actual Cost
Previous price:
₹100 per unit
New negotiated price:
₹92 per unit
Annual quantity:
10,000 units
Savings:
₹8 × 10,000
= ₹80,000
However, the baseline should be clearly defined.
Organizations may use:
The baseline must be consistent to make savings reporting meaningful.
Cost avoidance measures situations where procurement prevents a potential increase or additional cost.
For example:
A supplier proposes increasing the price from ₹100 to ₹110.
Procurement negotiates and agrees at ₹104.
The organization may report:
₹6 per unit as cost avoidance
The treatment of cost avoidance varies between organizations.
It is important to distinguish cost avoidance from actual realized savings.
Purchase Price Variance (PPV) measures the difference between an established reference price and the actual purchase price.
A simplified formula is:
PPV = Actual Purchase Price − Standard/Reference Price
For management reporting, the organization should clearly define whether favorable and unfavorable variances are shown as positive or negative.
PPV is particularly useful in manufacturing environments where material prices can significantly affect product cost.
Spend Under Management measures the percentage of organizational spend that is actively managed by procurement.
Formula:
Spend Under Management % = Procurement-Managed Spend ÷ Total Addressable Spend × 100
Total addressable spend:
₹100 crore
Spend actively managed by procurement:
₹75 crore
Spend under management:
75%
This KPI helps management understand how much of the organization’s purchasing activity is actually controlled or influenced by procurement.
Maverick spend refers broadly to purchases made outside approved procurement processes, suppliers, contracts or purchasing channels.
Examples include:
A high level of maverick spend can indicate:
The objective should not simply be to punish users.
Procurement should understand why the bypass happened.
PO compliance measures whether purchases follow the organization’s purchase order requirements.
A simple formula is:
PO Compliance % = Compliant Purchases ÷ Applicable Purchases × 100
A higher percentage generally indicates stronger process adherence.
This KPI becomes particularly important where the organization follows a No PO, No Pay or similar control.
Procurement cycle time measures how long it takes to move through a defined procurement process.
For example:
Purchase Requisition → Purchase Order
The formula can be:
Procurement Cycle Time = PO Approval Date/Time − PR Creation Date/Time
Organizations should define exactly which timestamps are included.
For example:
Breaking the cycle into stages often provides more actionable information than using one overall number.
This KPI measures how long procurement takes to convert an approved requirement into a purchase order.
For example:
PR approved:
Monday, 10:00 AM
PO released:
Tuesday, 2:00 PM
Processing time:
28 hours
If this KPI consistently increases, procurement should investigate the reason.
Potential causes include:
Supplier On-Time Delivery, commonly abbreviated as OTD, measures whether suppliers deliver according to agreed requirements.
A simple formula is:
OTD % = On-Time Deliveries ÷ Total Applicable Deliveries × 100
Total deliveries:
100
On-time deliveries:
94
OTD:
94%
However, organizations should clearly define what “on time” means.
For example:
A consistent definition is essential.
Procurement performance is strongly connected to supplier quality.
Possible measures include:
For example:
Supplier Rejection Rate = Rejected Quantity ÷ Received Quantity × 100
If a supplier delivers 20,000 pieces and 100 pieces are rejected:
Rejection Rate = 0.5%
In automotive and manufacturing environments, PPM is often useful.
PPM = Defective Units ÷ Total Units × 1,000,000
Supplier lead time measures the time between placing an order and receiving the required material or service.
For example:
PO date:
1 August
Receipt date:
11 August
Lead time:
10 days
Tracking supplier lead time helps procurement understand:
Supplier responsiveness measures how quickly suppliers respond to procurement requirements.
Possible measurements include:
This is particularly important for strategic and high-risk suppliers.
Organizations can combine several supplier KPIs into one score.
For example:
| Factor | Weight |
|---|---|
| Quality | 30% |
| Delivery | 30% |
| Cost | 20% |
| Responsiveness | 10% |
| Documentation | 10% |
Supplier performance score:
Quality × 30% + Delivery × 30% + Cost × 20% + Responsiveness × 10% + Documentation × 10%
The weights should reflect the organization’s priorities.
For a critical automotive component, quality and delivery may receive higher weighting.
Contract compliance measures whether purchases are made according to agreed contractual terms.
It can include:
A useful measure is:
Contract Compliance % = Compliant Spend ÷ Applicable Contract Spend × 100
This KPI helps procurement determine whether negotiated contracts are actually delivering the intended value.
Having a contract is not enough.
The organization should also measure whether employees are actually using it.
For example:
Contract value:
₹10 crore
Spend through contract:
₹8 crore
Contract utilization:
80%
Low utilization can indicate:
This KPI measures the proportion of applicable purchases that go through a competitive sourcing process.
A simplified formula is:
Competitive Sourcing Rate = Competitively Sourced Spend ÷ Applicable Spend × 100
It should be used carefully.
Not every purchase requires competition.
For example:
may require controlled exceptions.
Supplier concentration measures how dependent the organization is on a small number of suppliers.
For example:
If 70% of a critical raw material comes from one supplier, the organization may have significant supply risk.
Useful measures include:
This KPI moves procurement beyond cost and into supply risk management.
Procurement ROI attempts to measure the value generated relative to procurement operating costs.
A simplified formula can be:
Procurement ROI = Procurement Benefits ÷ Procurement Operating Cost
Benefits may include:
Because savings definitions vary, organizations should establish a consistent methodology before using this KPI for management reporting.
As procurement processes become increasingly digital, organizations can measure system adoption.
Examples:
This KPI helps identify whether technology investments are actually being used.
Procurement is an internal service function as well as a commercial function.
Stakeholder satisfaction can measure how internal users perceive procurement.
Survey areas may include:
A procurement team should not optimize every KPI at the expense of stakeholder experience.
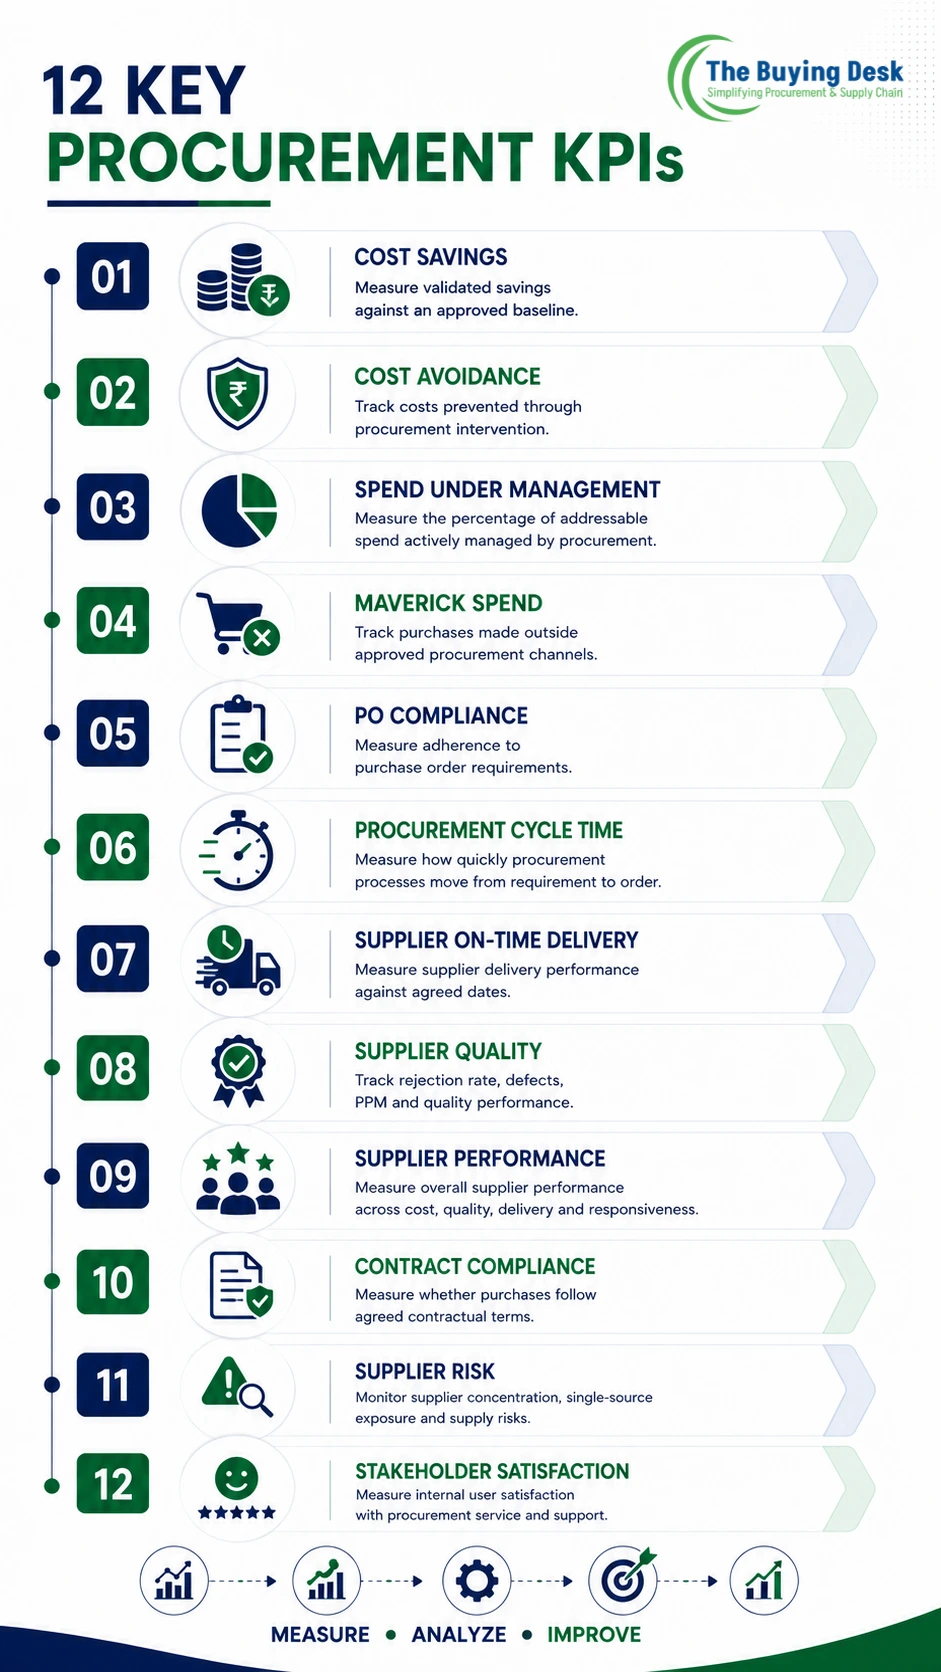
One of the biggest mistakes organizations make is tracking too many KPIs.
A better approach is to create a balanced dashboard.
For example:
| Category | KPI | Target Example |
|---|---|---|
| Cost | Cost Savings | ≥ 5% |
| Cost | PPV | Within budget |
| Spend | Spend Under Management | ≥ 80% |
| Compliance | PO Compliance | ≥ 95% |
| Compliance | Maverick Spend | ≤ 5% |
| Delivery | Supplier OTD | ≥ 95% |
| Quality | Supplier Quality | ≥ 99% |
| Process | PO Cycle Time | ≤ 2 days |
| Supplier | Supplier Performance | ≥ 90% |
| Contract | Contract Utilization | ≥ 90% |
| Risk | Single-Source Coverage | Monitored |
| Digital | Digital Adoption | ≥ 90% |
These are illustrative targets only.
Every organization should establish targets according to its industry, procurement maturity, category and business requirements.
A practical monthly dashboard can be divided into five sections.
Track:
Track:
Track:
Track:
Track:
A KPI without a target is simply a measurement.
Targets should be:
Specific
Clearly defined.
Measurable
Based on reliable data.
Relevant
Connected to business objectives.
Time-bound
Measured over a defined period.
Realistic
Challenging but achievable.
For example:
Instead of:
Improve supplier delivery.
Use:
Increase supplier on-time delivery from 91% to 96% by the end of Q4.
That creates a measurable objective.
Before setting aggressive targets, establish a baseline.
Suppose supplier OTD is currently:
87%
Management sets a target of:
99%
That may sound positive, but the target may not be realistic without understanding:
A baseline helps establish a practical improvement path.
Procurement KPIs can come from several systems.
Useful for:
Useful for:
Useful for:
Useful for:
Useful for:
Useful for combining data into management reports.
Savings are important, but procurement can create value through:
A dashboard with 50 KPIs can make it difficult to identify priorities.
A smaller set of meaningful KPIs is often more effective.
If one department calculates OTD differently from another, comparisons become meaningless.
Incorrect supplier codes, duplicate POs or incomplete receipt dates can produce misleading KPIs.
Targets should reflect actual business conditions.
A KPI dashboard should trigger decisions.
For example:
OTD ↓
→ Identify affected suppliers
→ Analyze root cause
→ Create corrective action
→ Monitor improvement
The real value of KPIs comes from the action that follows.
KPI:
OTD = 88%
Action:
KPI:
Maverick Spend = 14%
Action:
KPI:
PR-to-PO = 6 days
Action:
Different KPIs should be reviewed at different frequencies.
Useful for operational KPIs:
Useful for:
Useful for:
Useful for:
A procurement scorecard can combine performance indicators into an overall view.
For example:
| Area | Weight | Score |
|---|---|---|
| Cost | 25% | 90 |
| Quality | 20% | 95 |
| Delivery | 20% | 88 |
| Supplier | 15% | 92 |
| Compliance | 10% | 96 |
| Process | 10% | 85 |
The organization can calculate an overall weighted score.
However, a single score should not replace the underlying KPIs.
A supplier with a good overall score may still have a critical weakness in quality or supply risk.
Manufacturing organizations often require additional focus on:
For a manufacturing procurement team, a supplier being “cheap” but consistently late can create much greater business cost than the purchase price suggests.
Indirect procurement may focus more heavily on:
The KPI mix should therefore reflect the procurement category.
Strategic procurement may emphasize:
This demonstrates why there is no universal procurement KPI dashboard.
These are related but not identical.
Procurement KPIs measure the performance of the procurement function.
Examples:
Supplier KPIs measure supplier performance.
Examples:
A procurement dashboard may include both.
The ultimate purpose of procurement KPIs is not to create reports.
It is to connect procurement activity with business outcomes.
For example:
Procurement KPI
Supplier OTD
↓
Operational Outcome
Fewer material shortages
↓
Business Outcome
More stable production
↓
Customer Outcome
Better delivery reliability
This is the level at which procurement KPIs become strategically valuable.
For organizations starting from scratch, use this framework:
What does procurement need to achieve?
What business results matter most?
Choose only meaningful indicators.
Ensure everyone calculates them consistently.
Understand current performance.
Create realistic improvement targets.
Automate reporting where possible.
Discuss trends, not only monthly numbers.
Every major gap should have an owner.
Use KPI trends to continuously improve procurement.
Procurement performance cannot be measured by savings alone.
A modern procurement function should monitor a balanced combination of:
The most important principle is:
A good procurement KPI does not merely tell you what happened. It helps you decide what to do next.
A procurement dashboard should therefore connect measurement → analysis → action → improvement.
When procurement KPIs are properly defined and consistently measured, procurement moves from being viewed primarily as a transactional purchasing function to a measurable business value function.
What are procurement KPIs?
Procurement KPIs are measurable indicators used to evaluate procurement performance, efficiency, cost, supplier performance, compliance and business value.
What is the most important procurement KPI?
There is no single KPI that is most important for every organization. Cost savings, supplier OTD, quality, spend under management, procurement cycle time and compliance are commonly important.
How is procurement cost savings calculated?
A basic calculation is:
Cost Savings = Baseline Cost − Actual/Negotiated Cost
The organization should define and consistently apply its savings methodology.
What is procurement cycle time?
Procurement cycle time measures the time required to complete a defined procurement activity, such as moving from an approved purchase requisition to a released purchase order.
What is supplier OTD?
Supplier OTD means Supplier On-Time Delivery. It measures the percentage of applicable supplier deliveries received according to the agreed delivery requirement.
What is maverick spend?
Maverick spend is purchasing that occurs outside approved procurement processes, suppliers, contracts or purchasing channels.
How many procurement KPIs should a company track?
There is no universal number. A focused dashboard containing a manageable number of strategically important KPIs is generally more useful than tracking dozens of indicators.
What is the difference between cost savings and cost avoidance?
Cost savings generally represents a reduction against an established baseline, while cost avoidance generally represents preventing a potential future increase or additional cost.
Why is supplier quality a procurement KPI?
Supplier quality directly affects production, customer satisfaction, rework, inventory and total cost. Procurement therefore needs visibility of supplier quality performance.
How often should procurement KPIs be reviewed?
Operational KPIs may be reviewed daily or weekly, while financial, compliance and strategic KPIs are often reviewed monthly or quarterly.