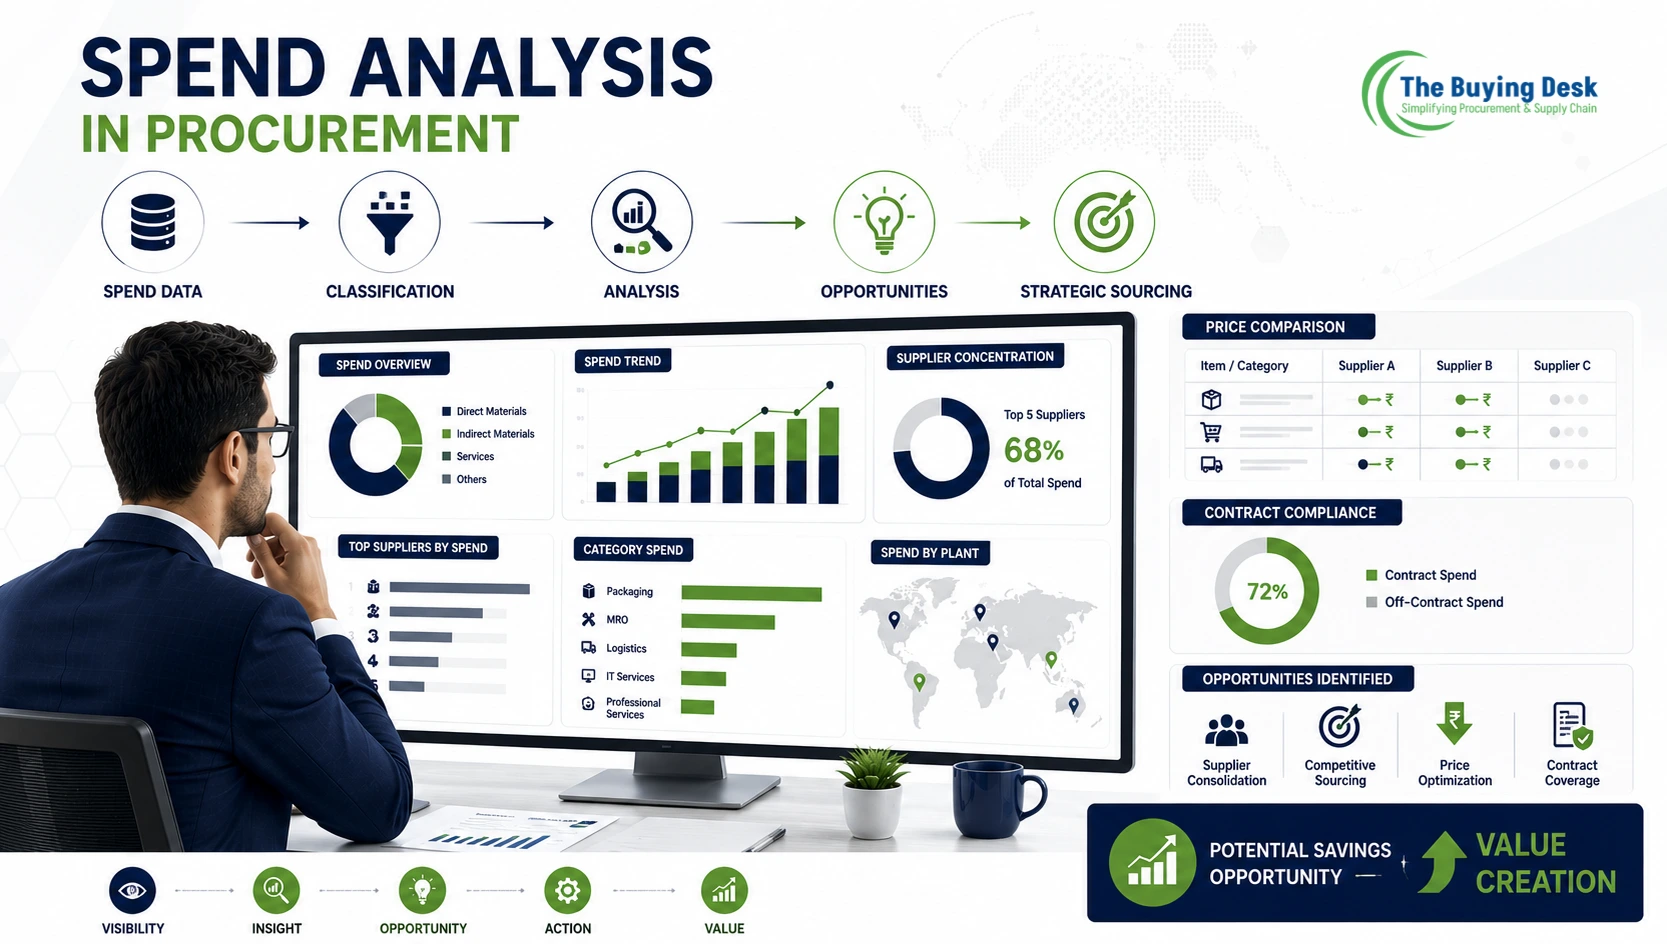
Spend analysis is one of the most important foundations of strategic sourcing and procurement transformation.
Before procurement can identify savings opportunities, consolidate suppliers, negotiate effectively or develop category strategies, it needs to understand where the organization is spending money, with whom, on what, how much and under what purchasing conditions.
Without reliable spend visibility, procurement decisions can become reactive and fragmented.
With good spend analysis, procurement teams can identify:
The basic idea is simple:
You cannot strategically manage spend that you cannot clearly see and understand.
This article explains what spend analysis is, why it matters, how the process works, what data is required, which analyses procurement teams should perform, common challenges, useful KPIs and how spend analysis supports strategic sourcing.
Spend analysis is the systematic process of collecting, cleansing, classifying, analyzing and interpreting procurement expenditure data to understand organizational spending patterns and identify opportunities for cost, value, compliance and risk improvement.
It brings together purchasing information from different sources and converts transactional data into actionable procurement intelligence.
A simplified model is:
Procurement Data → Clean Data → Categorized Spend → Analysis → Insights → Sourcing Strategy → Savings & Value
Spend analysis can cover:
Procurement organizations often manage thousands of purchase transactions across multiple suppliers, plants, business units and categories.
Looking at individual purchase orders rarely provides the complete picture.
Spend analysis creates that broader view.
For example, a company may believe it spends with 20 suppliers for a particular category.
After consolidating supplier names and analyzing historical transactions, it may discover that:
20 supplier names = 12 actual supplier groups
and that several business units are purchasing the same category independently.
That insight can create opportunities for:
Basic spend reporting answers:
“How much did we spend?”
Spend analysis asks much more:
“Where did we spend it, with whom, on what, at what price, under which contracts, with what level of supplier concentration and what opportunities exist to improve the outcome?”
This distinction is important.
Reporting describes historical activity.
Analysis helps procurement make better decisions.
A strong spend analysis program generally aims to achieve several objectives.
Understand total procurement expenditure across the organization.
Find categories, suppliers and transactions where commercial improvement may be possible.
Understand supplier dependency, fragmentation and spending concentration.
Provide the data needed to prioritize sourcing projects.
Identify purchases occurring outside approved contracts or negotiated arrangements.
Detect purchasing outside approved procurement channels.
Identify excessive dependency on individual suppliers, locations or categories.
Create reliable baselines for savings, sourcing coverage and procurement KPIs.
A practical spend analysis process can be represented as:
1. Define Scope → 2. Collect Data → 3. Clean Data → 4. Normalize Suppliers → 5. Classify Spend → 6. Analyze → 7. Identify Opportunities → 8. Prioritize → 9. Develop Actions → 10. Monitor
Each stage contributes to the quality of the final procurement insight.
Before collecting data, procurement should define what it wants to analyze.
The scope may include:
The scope should match the business question.
For example:
“Why are logistics costs increasing?”
requires a different dataset from:
“How can we consolidate our packaging suppliers?”
Spend data can come from multiple systems.
A major challenge is that procurement information is often distributed across different systems.
Raw procurement data is rarely ready for strategic analysis.
It may contain:
Data cleansing converts raw transactional information into a usable dataset.
Supplier normalization is particularly important.
The same supplier may appear as:
ABC Industries Ltd.
ABC Industries
ABC Ind. Pvt. Ltd.
ABC INDUSTRIES PVT LTD
Without normalization, these may appear to be four different suppliers.
After consolidation, procurement may discover that all four records represent one supplier.
This can materially change supplier concentration and category analysis.
Spend classification assigns transactions to meaningful procurement categories.
For example:
Manufacturing Spend
→ Raw Materials
→ Components
→ Packaging
→ MRO
→ Logistics
→ Industrial Services
Classification can be performed using:
Good classification is critical because poor classification produces misleading conclusions.
Once the data is clean and categorized, procurement can analyze it from multiple perspectives.
Important dimensions include:
Analysis should lead to actionable opportunities.
Examples include:
Not every opportunity deserves the same level of effort.
Procurement can prioritize based on:
Spend + Savings Potential + Risk + Business Impact + Complexity
A high-spend category with strong supplier competition may receive higher priority than a low-value category with limited alternatives.
Each major opportunity should have a defined action plan.
For example:
Opportunity: Supplier fragmentation
Action: Consolidate volume and conduct competitive RFQ
Owner: Category Manager
Target: Q3
Expected Outcome: Improved commercial competitiveness
Spend analysis should not be a one-time exercise.
Procurement should periodically monitor:
This converts spend analysis into an ongoing management capability.
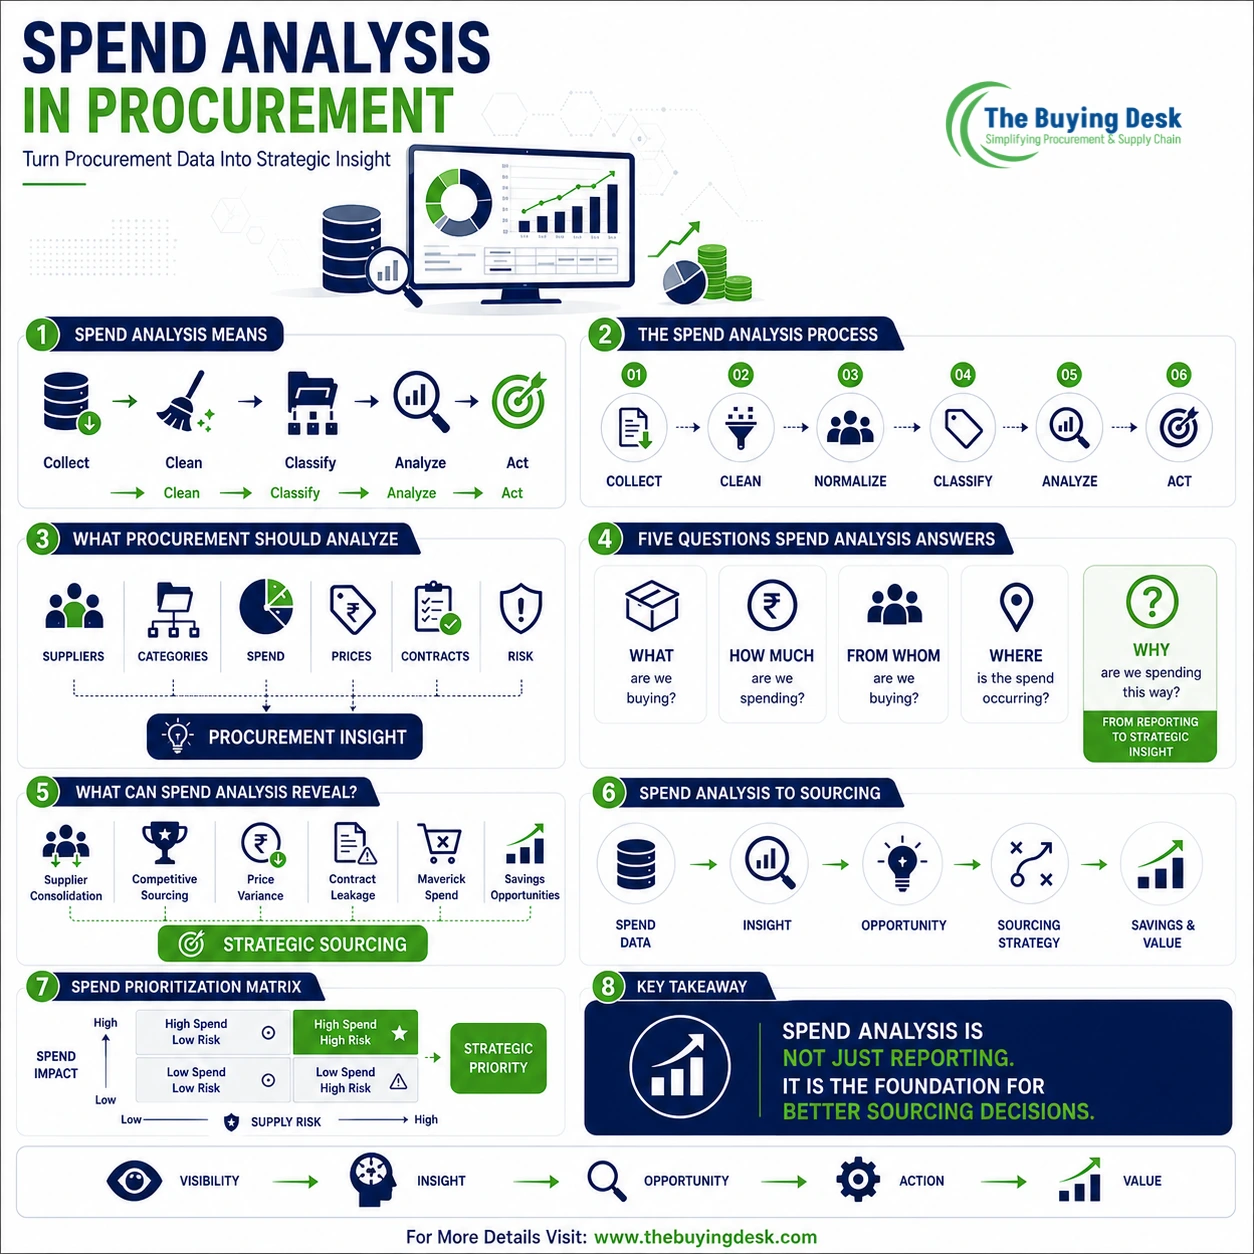
A useful spend analysis framework asks:
What are we buying?
Identify categories, materials, services and commodities.
How much are we spending?
Understand total spend, volume and trends.
Which suppliers are receiving the spend?
Understand supplier concentration and fragmentation.
Where is the spend occurring?
Analyze plants, locations, business units and geographies.
Why are we spending this way?
Investigate purchasing behavior, specifications, demand, supplier selection and contract structures.
The fifth question is often the most valuable because it moves analysis from description toward strategic decision-making.
Direct spend refers to goods and services that are directly incorporated into or support the production of the organization’s products or core services.
Examples include:
Direct spend analysis can influence:
Because of this, direct spend often receives significant strategic sourcing attention.
Indirect spend supports business operations but is not normally incorporated directly into the finished product.
Examples include:
Indirect spend is often highly fragmented, making spend analysis particularly valuable.
Supplier-level analysis identifies how much the organization spends with each supplier.
A simple ranking may look like:
| Supplier | Annual Spend | Share of Category |
|---|---|---|
| Supplier A | ₹8 crore | 40% |
| Supplier B | ₹5 crore | 25% |
| Supplier C | ₹3 crore | 15% |
| Supplier D | ₹2 crore | 10% |
| Others | ₹2 crore | 10% |
This immediately shows that Supplier A has significant exposure.
But high supplier concentration is not automatically bad.
The correct question is:
Is the concentration intentional, commercially beneficial and appropriately managed from a risk perspective?
Category analysis groups spending into meaningful procurement categories.
For example:
Packaging
→ Corrugated Boxes
→ Flexible Packaging
→ Labels
→ Protective Materials
Procurement can then understand which categories deserve strategic attention.
Supplier concentration measures how heavily a category depends on a limited number of suppliers.
High concentration may provide:
But it can also create:
The correct sourcing strategy depends on the category’s risk and market characteristics.
Organizations with multiple divisions may discover that the same supplier or category is being managed differently across business units.
For example:
Plant A → Supplier X
Plant B → Supplier Y
Plant C → Supplier Z
If specifications are similar and suppliers serve the same market, procurement may have an opportunity to aggregate demand.
Global organizations should analyze spend by:
This can reveal opportunities related to:
Historical spend analysis shows how expenditure changes over time.
Procurement can compare:
Month → Quarter → Year
and identify:
Trend analysis becomes particularly useful when combined with market intelligence.
Price variance analysis compares prices paid for similar or identical items.
For example:
| Plant | Supplier | Unit Price |
|---|---|---|
| Plant A | Supplier X | ₹100 |
| Plant B | Supplier X | ₹108 |
| Plant C | Supplier Y | ₹96 |
This raises important questions:
Price variation does not automatically mean overpayment, but it is an important signal for investigation.
Maverick spend refers broadly to purchases made outside approved procurement processes, contracts or preferred supplier arrangements.
Examples include:
Approved Supplier Price: ₹100
Off-contract Purchase: ₹115
If similar purchases repeatedly occur outside the negotiated arrangement, procurement may lose potential value.
Spend analysis can help identify:
Contract compliance analysis compares actual spending with contracted arrangements.
Procurement can examine:
Contracted Spend ÷ Addressable Spend × 100
A low ratio may indicate:
Contract compliance is important because negotiated savings are not realized if employees continue purchasing outside the agreement.
Supplier fragmentation occurs when many suppliers are used for similar requirements.
For example:
100 suppliers → one category
may indicate an opportunity for consolidation.
But consolidation should not be automatic.
Procurement should consider:
Pareto analysis helps procurement identify the relatively small number of suppliers or categories responsible for a large portion of total spend.
A typical analysis may reveal:
A small number of categories represent a large share of total spend.
These high-impact categories can then receive greater strategic attention.
The exact distribution varies by organization, so procurement should analyze its own data rather than assume a fixed percentage.
ABC analysis can also help prioritize procurement attention.
High-value or high-impact categories requiring close strategic management.
Medium-value categories requiring structured management.
Lower-value categories where process efficiency and automation may be more important than intensive sourcing effort.
ABC analysis should not be based on spend alone when risk or business criticality is high.
A useful procurement framework is to assess categories using:
Spend Impact × Supply Risk × Savings Opportunity
This can create four broad groups.
Requires strategic sourcing and strong risk management.
Often strong candidates for competitive sourcing and negotiation.
May require supplier continuity planning despite lower financial value.
Often suitable for process simplification, catalogs or automation.
Spend analysis can reveal several potential savings levers.
Combine fragmented demand where appropriate.
Introduce qualified supplier competition.
Combine purchases across plants or business units.
Review whether requirements can be standardized.
Question whether the organization needs the same quantity, frequency or specification.
Use spend visibility to strengthen negotiations.
Reduce unnecessary supplier duplication.
Reduce transaction costs and administrative effort.
Spend analysis is often the starting point for a strategic sourcing project.
The relationship can be represented as:
Spend Analysis
↓
Category Prioritization
↓
Market Analysis
↓
Sourcing Strategy
↓
Supplier Discovery
↓
RFx
↓
Supplier Evaluation
↓
Negotiation
↓
Supplier Selection
↓
Implementation
Spend analysis therefore provides the evidence base for sourcing decisions.
Category management requires procurement teams to understand categories strategically.
Spend analysis helps answer:
This information becomes the foundation for category strategies.
Spend analysis also supports supplier management.
It can identify:
This helps procurement determine where supplier development, performance management or relationship governance deserves greater attention.
A useful spend dataset may contain:
| Data Field | Purpose |
|---|---|
| Supplier name | Supplier analysis |
| Supplier ID | Supplier normalization |
| Item description | Category classification |
| Item code | Material identification |
| Category | Spend segmentation |
| Purchase order | Transaction analysis |
| Invoice | Payment analysis |
| Quantity | Volume analysis |
| Unit price | Price analysis |
| Total value | Spend analysis |
| Currency | Financial normalization |
| Business unit | Organizational analysis |
| Plant | Location analysis |
| Buyer | Procurement ownership |
| Contract ID | Compliance analysis |
| Purchase date | Trend analysis |
The more complete the data, the more useful the analysis can become.
Spend analysis is often limited by data quality rather than analytical capability.
Common issues include:
The same supplier appears under multiple names.
Similar materials have different descriptions.
Transactions cannot easily be assigned to categories.
Global data requires currency normalization.
Quantities may not be directly comparable.
Purchases cannot easily be linked to contracts.
Different business units may use different data structures.
Procurement teams can improve data quality by establishing:
Spend analysis should become easier over time rather than requiring a complete data-cleaning exercise every cycle.
A spend taxonomy is a structured classification system used to organize procurement expenditure.
A simple hierarchy might be:
Level 1: Direct / Indirect
↓
Level 2: Category
↓
Level 3: Subcategory
↓
Level 4: Commodity
For example:
Indirect
→ MRO
→ Bearings
→ Industrial Bearings
→ Specific Product Family
A consistent taxonomy allows procurement to compare spending across business units and time periods.
Spend analysis can be performed using different technology levels.
Suitable for:
Tools such as spreadsheet software can support:
Useful for:
More advanced platforms may provide:
The technology should match the organization’s data maturity and analytical requirements.
Procurement can monitor several spend-related indicators.
The portion of organizational expenditure that procurement can potentially influence.
The portion of spend actively managed by procurement.
Spend associated with approved contracts.
Percentage of relevant spend purchased under negotiated contractual arrangements.
Spend occurring outside approved procurement channels.
Percentage of category spend held by major suppliers.
Total spend by procurement category.
Estimated value of identified sourcing or commercial opportunities.
The portion of identified savings actually achieved.
Spend Under Management ÷ Addressable Spend × 100
Contract-Compliant Spend ÷ Relevant Spend × 100
Spend With Selected Supplier Group ÷ Total Category Spend × 100
Realized Savings ÷ Approved Savings Target × 100
These formulas should be adapted to the organization’s own definitions and reporting policies.
Total spend alone does not explain supplier, category or transaction behavior.
Duplicate supplier records can distort concentration and opportunity analysis.
Price differences may be justified by specifications, volumes, freight, quality or commercial terms.
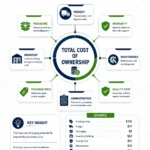
Total Cost of Ownership may be more important than purchase price.
A sourcing opportunity may not be attractive if it materially increases supply risk.
A dashboard is not the objective.
The objective is better procurement decisions.
Spend patterns change continuously.
Regular analysis is more valuable than occasional analysis.
A strong procurement organization follows:
Visibility → Insight → Opportunity → Action → Measurement
Not:
Data → Dashboard → End
For each major opportunity, procurement should define:
Consider a manufacturing company with annual packaging spend of:
₹12 crore
The initial analysis shows:
Further analysis identifies:
₹7 crore of addressable spend concentrated across common packaging categories.
Procurement identifies opportunities for:
The spend analysis does not itself create the savings.
It identifies where procurement should focus its sourcing effort.
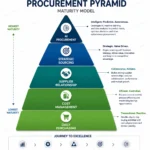
Organizations at different procurement maturity levels may approach spend differently.
“How much did we spend?”
“Where did we spend and with whom?”
“Why did we spend this way, what risks exist, and where can we create additional value?”
“How can spend intelligence continuously shape category strategy, supplier strategy and business decisions?”
This progression illustrates how spend analysis supports procurement maturity.
A strong spend analysis program should:
Ensure procurement, finance and business teams understand key terms consistently.
Avoid treating the same supplier as multiple entities.
Use a stable category structure.
Look beyond supplier and total spend.
High spend is not the only reason to prioritize a category.
Ensure insights lead to sourcing projects and commercial actions.
Compare actual outcomes against the original baseline.
Keep spend intelligence current.
Before starting a strategic sourcing initiative, procurement should be able to answer:
If these questions cannot be answered reliably, the category may not yet have sufficient spend visibility for a mature sourcing strategy.
Spend analysis is much more than a procurement report.
It is the analytical foundation that helps procurement understand where money is going and where better decisions can create value.
The complete logic is:
Collect → Clean → Classify → Analyze → Identify → Prioritize → Source → Implement → Measure
The most important shift is from:
“We know how much we spent.”
to:
“We understand why we spent it, where the opportunities are and what procurement should do next.”
For strategic sourcing, that distinction is critical.
Spend visibility creates the foundation.
Strategic sourcing converts the insight into action.
Procurement performance measures the result.
What is spend analysis in procurement?
Spend analysis is the process of collecting, cleansing, classifying and analyzing procurement expenditure data. It helps identify spending patterns, suppliers, categories, risks and improvement opportunities.
Why is spend analysis important?
It gives procurement visibility into where money is being spent and with whom. This helps identify savings opportunities, supplier concentration, contract leakage, maverick spend and sourcing priorities.
What data is needed for spend analysis?
Typical data includes supplier, item, category, quantity, unit price, total value, purchase order, invoice, business unit, plant, contract and transaction date.
What is supplier normalization in spend analysis?
Supplier normalization consolidates different names or records that represent the same supplier. This prevents supplier spend from being fragmented across multiple records.
How does spend analysis support strategic sourcing?
Spend analysis identifies high-value categories, supplier concentration, price variations and potential opportunities. Procurement can then use these insights to prioritize market analysis, RFx events and sourcing strategies.
What is maverick spend?
Maverick spend generally refers to purchases made outside approved procurement processes, contracts or preferred supplier arrangements. It can reduce negotiated value and make spending harder to control.
How often should procurement perform spend analysis?
There is no single frequency for every organization. Strategic categories may benefit from continuous or periodic monitoring, while smaller categories may be reviewed less frequently based on spend, risk and business importance.
Can small businesses use spend analysis?
Yes. Even a simple supplier and category spend analysis can reveal concentration, duplicate suppliers, price differences and negotiation opportunities without requiring sophisticated technology.